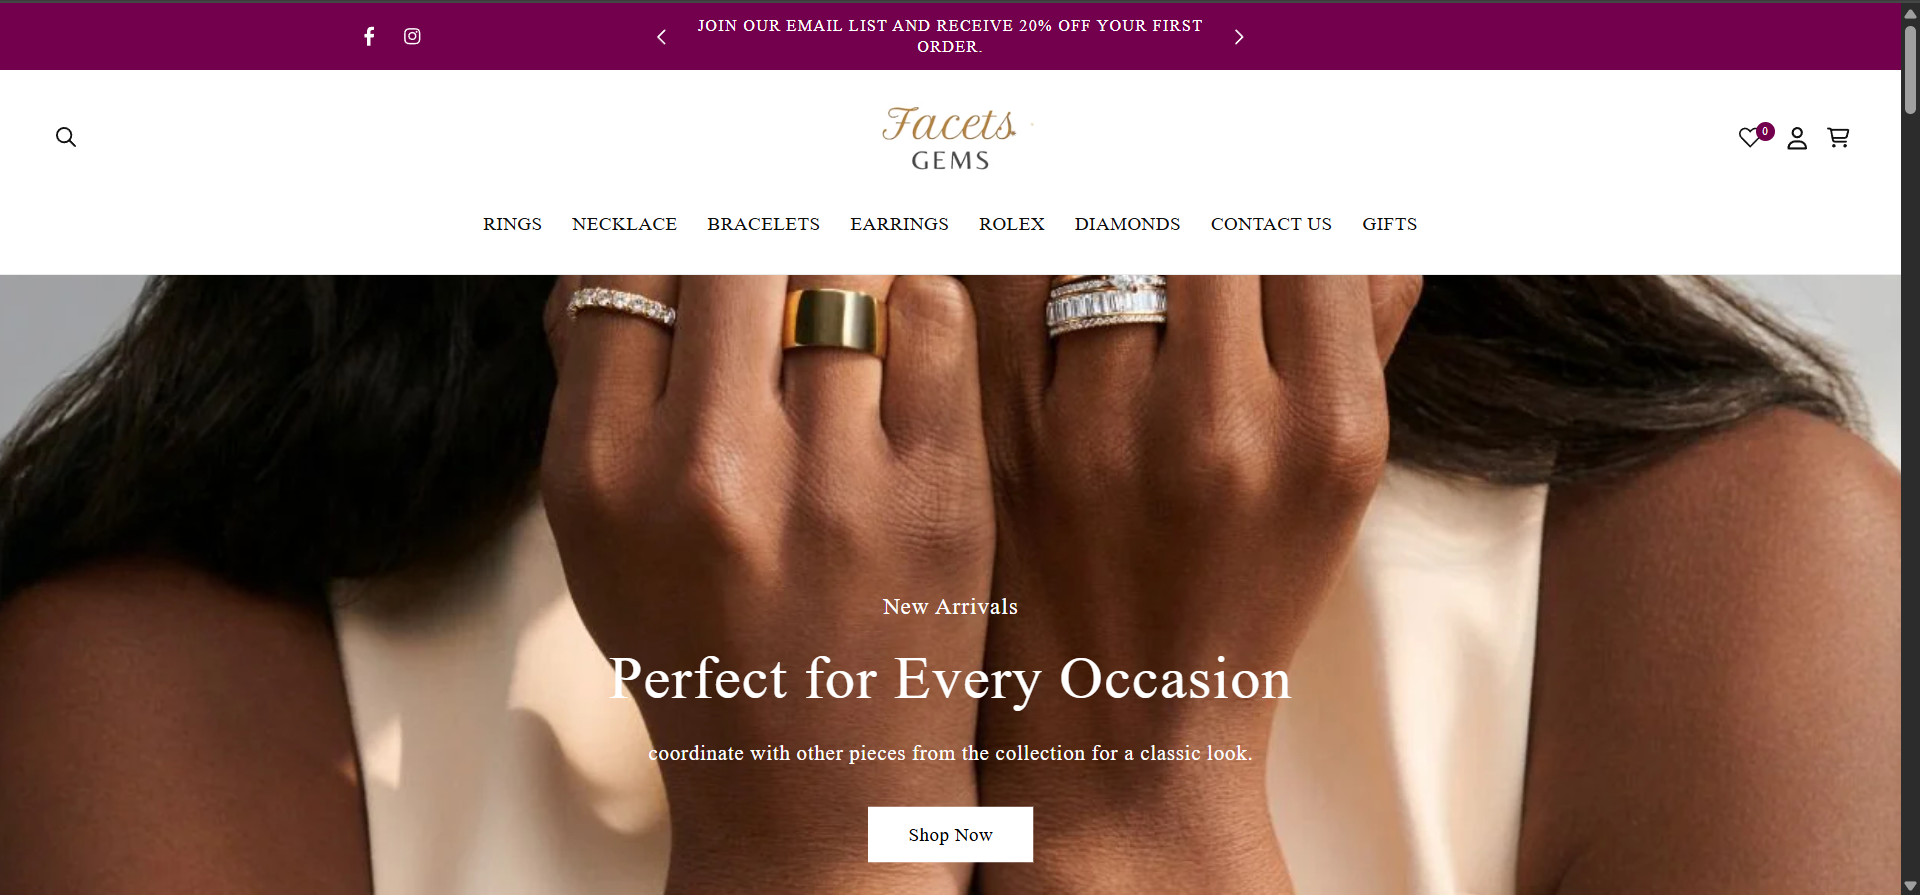
Digital Marketing For Jewelry Brands

Discover Exactly What’s Holding Your Jewelry Brand Back

0%

1. What type of jewelry business do you run?

Retail jewelry store
Online jewelry brand
Wholesale / B2B supplier
Custom or handmade jewelry

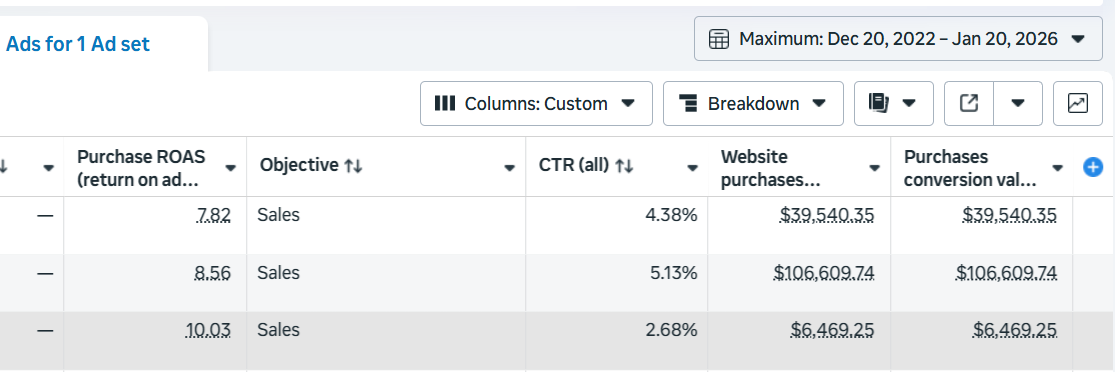
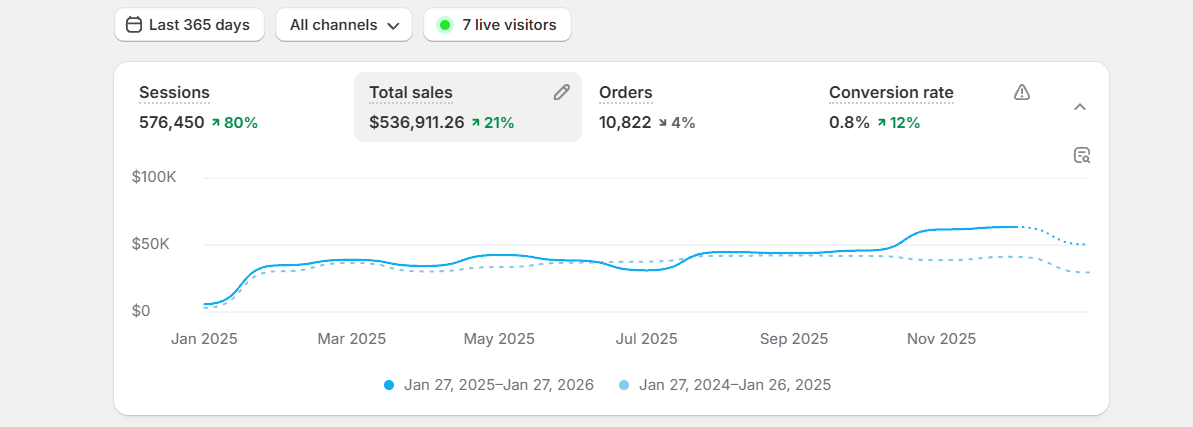
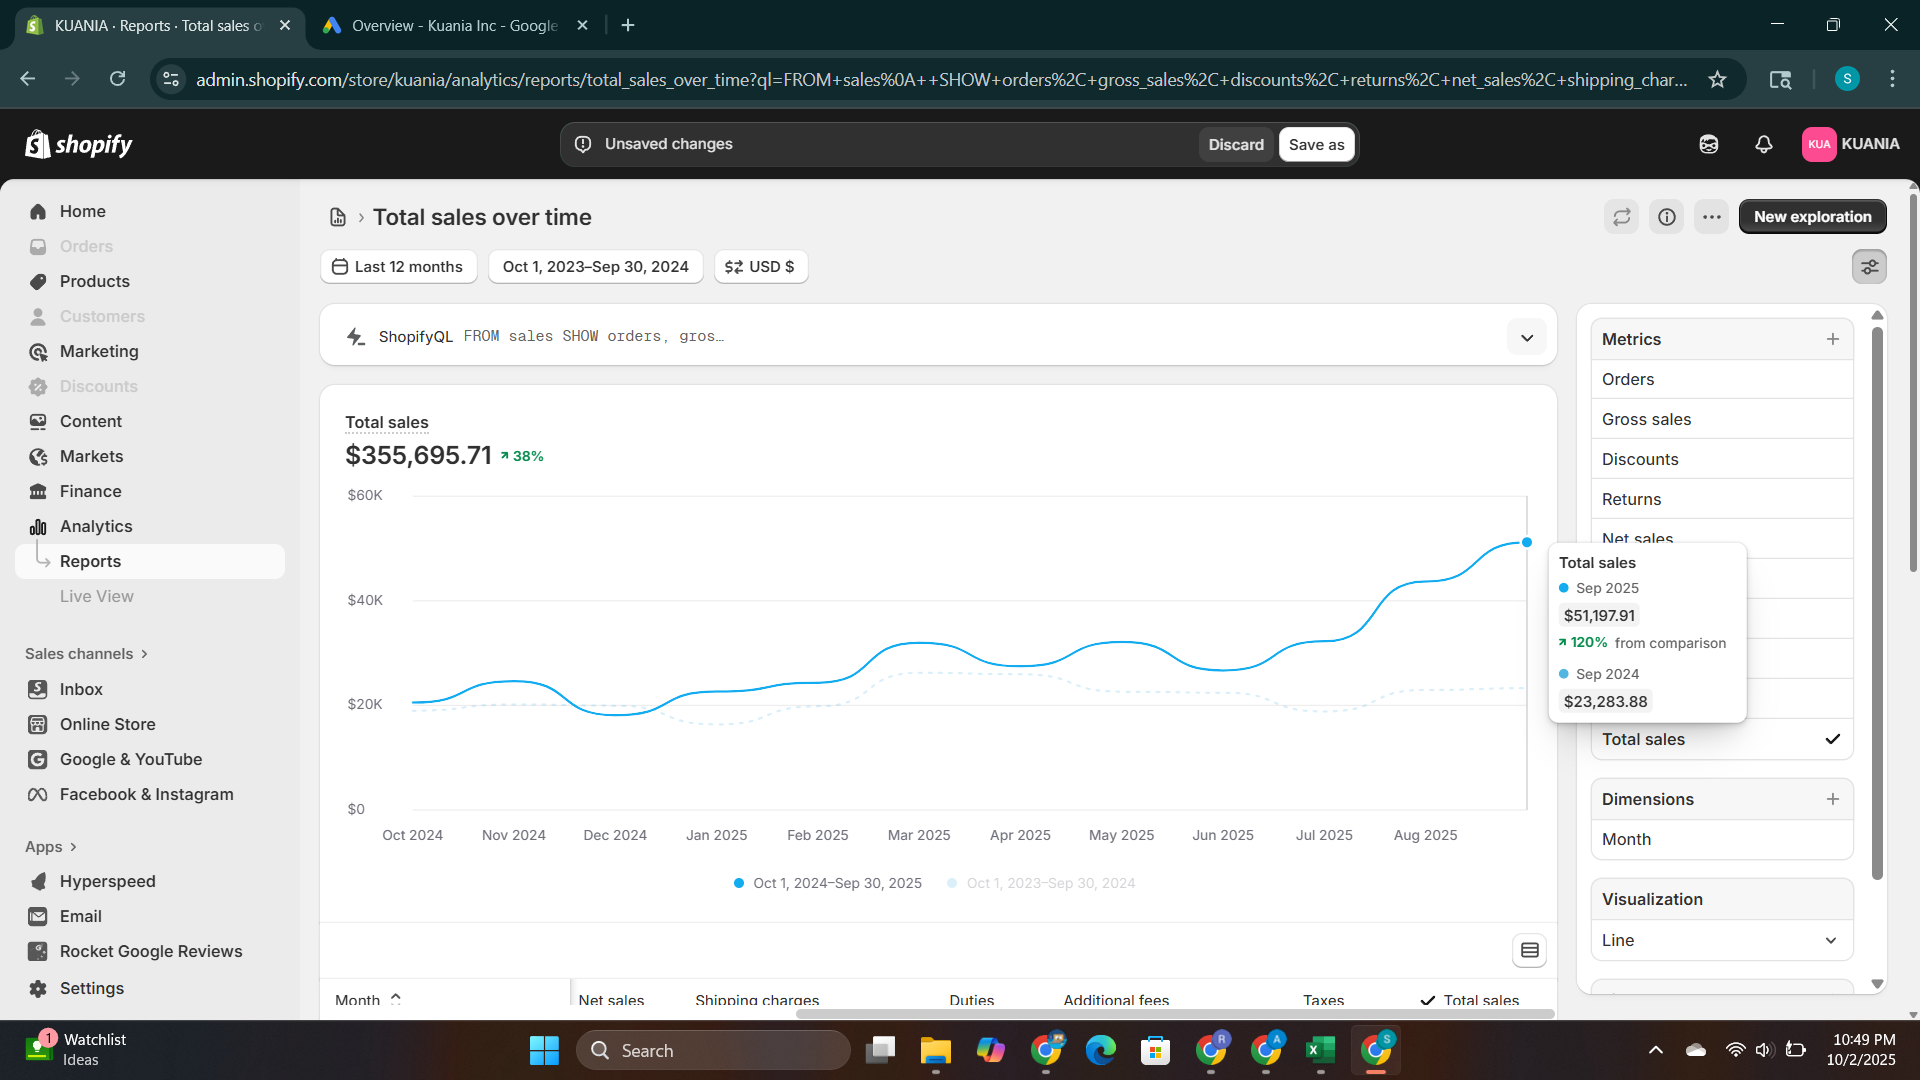
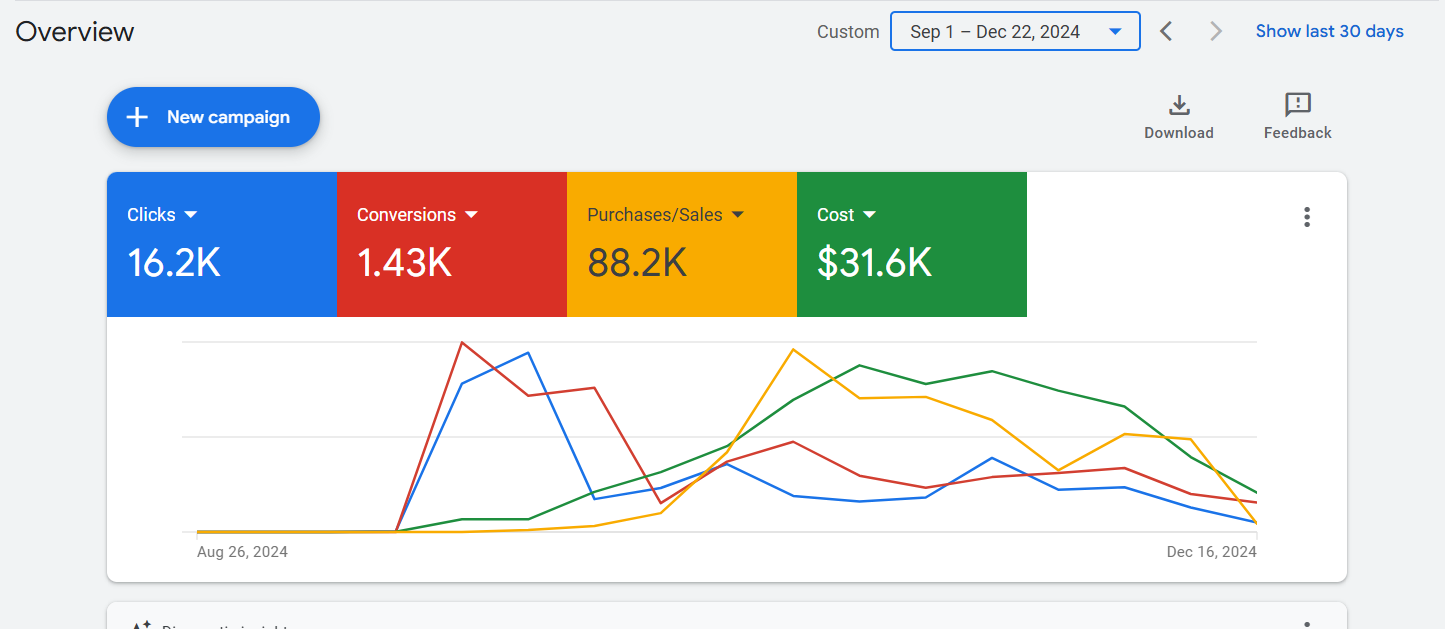
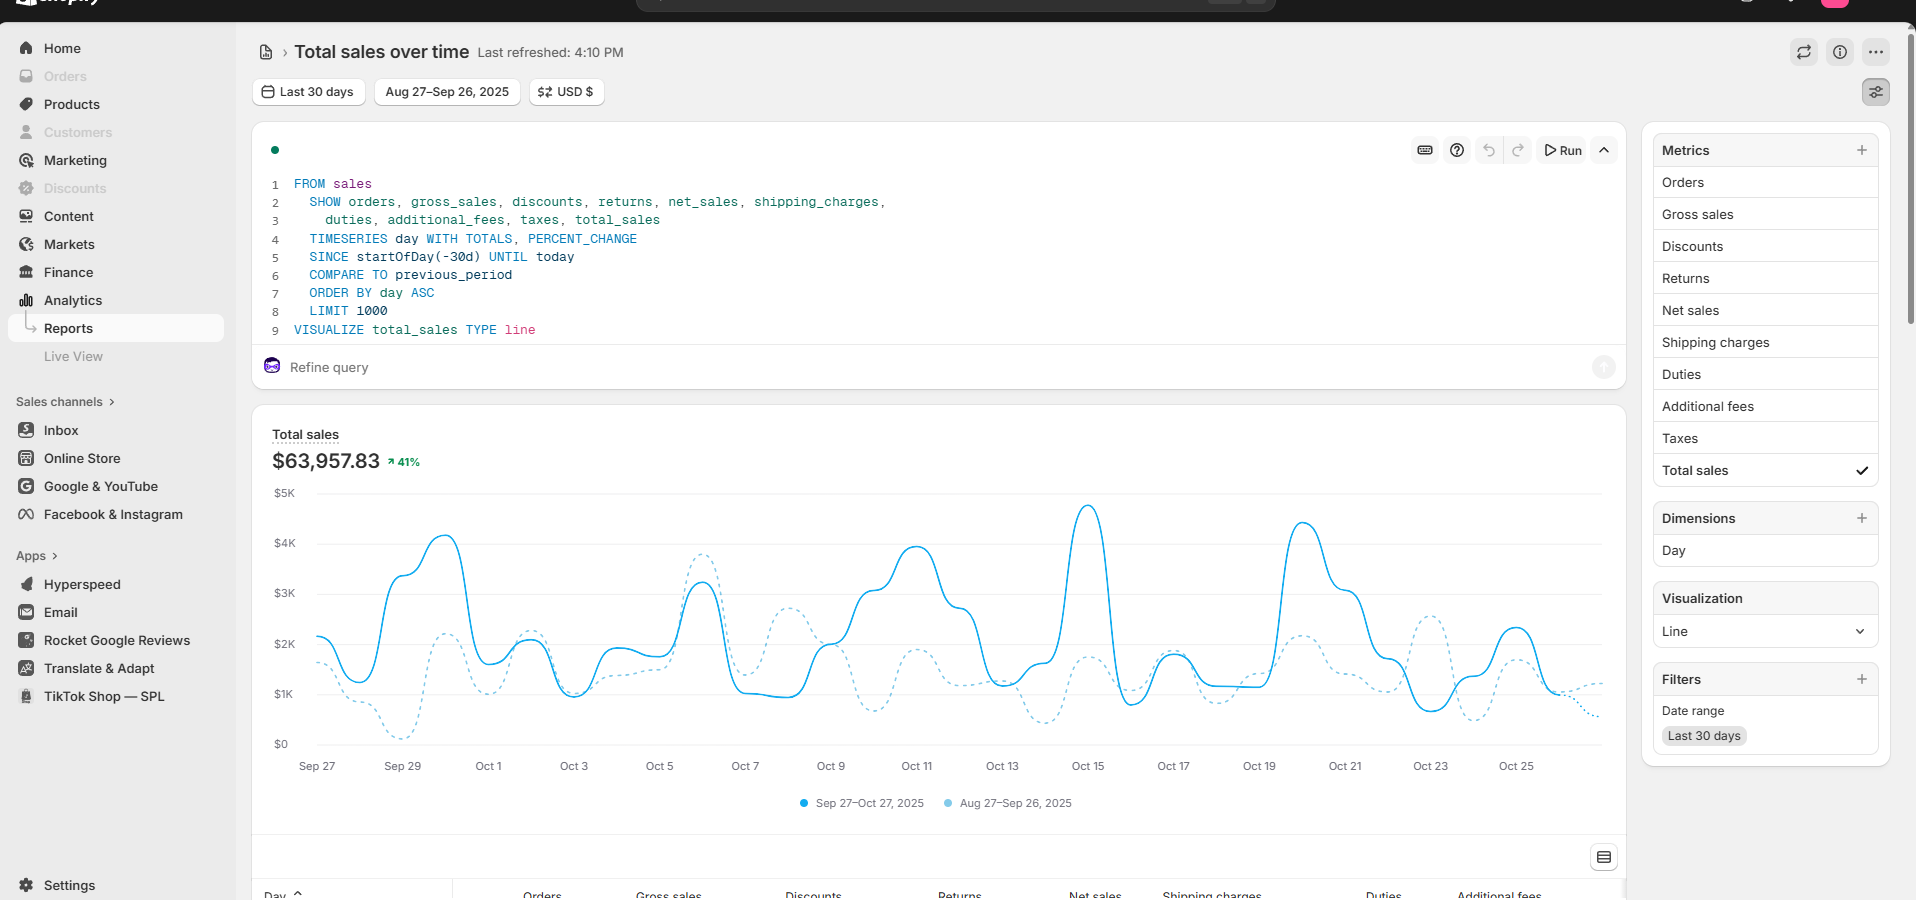
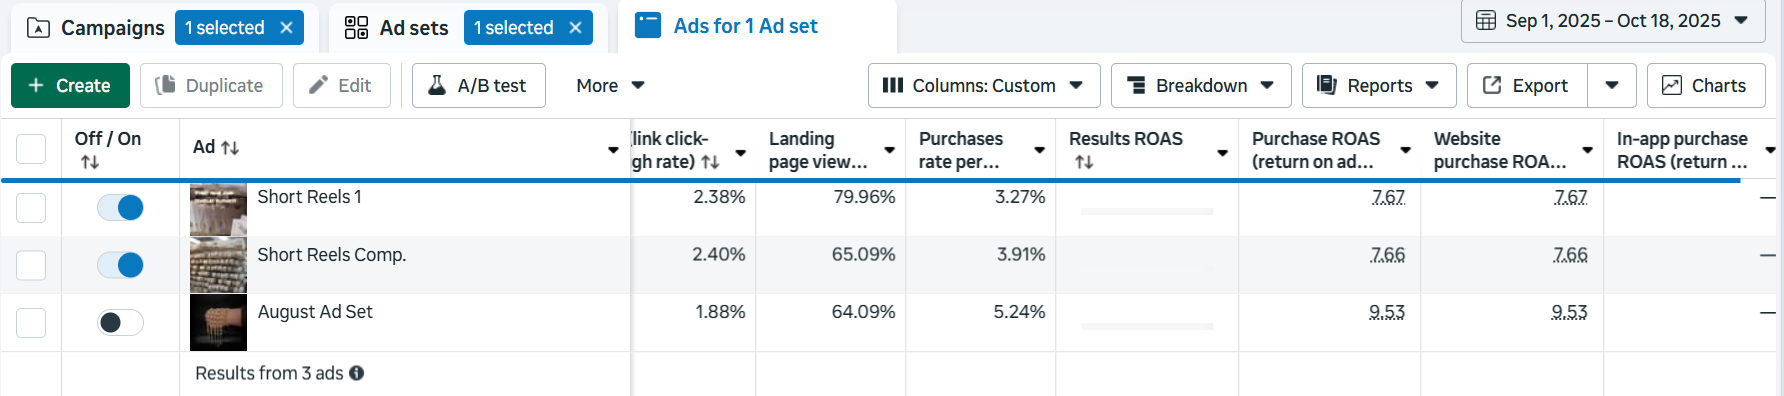
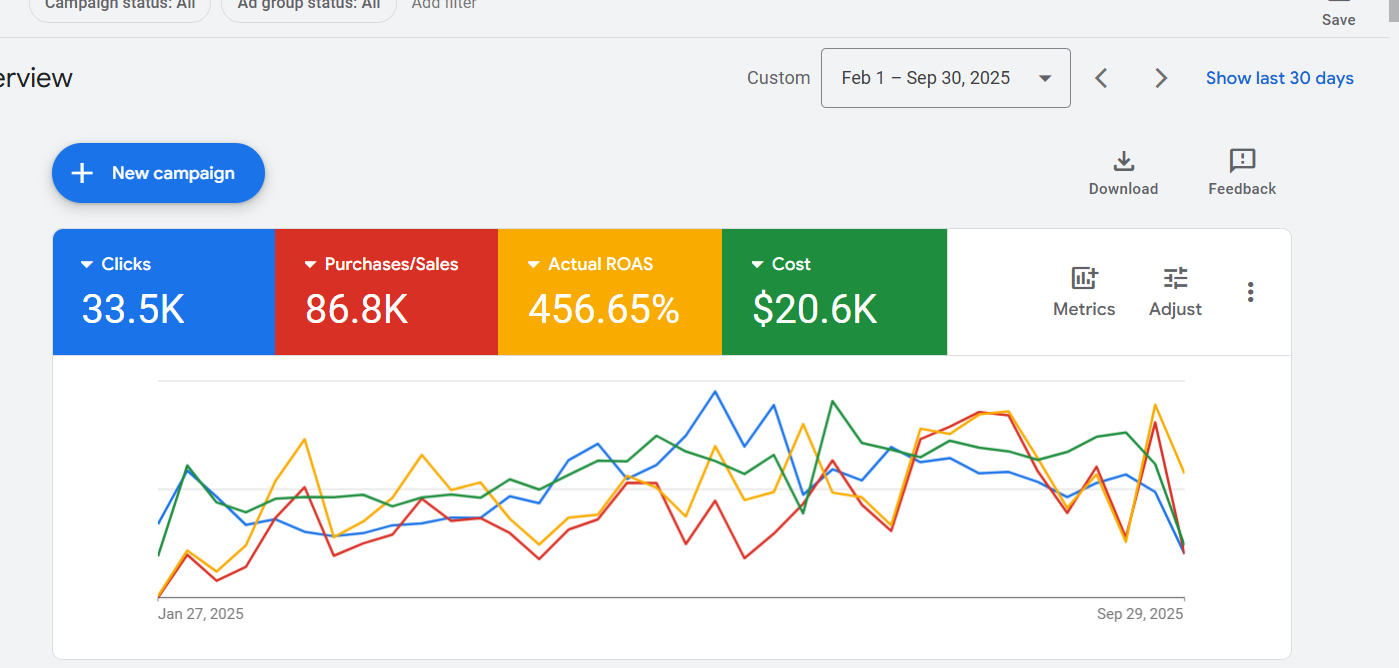
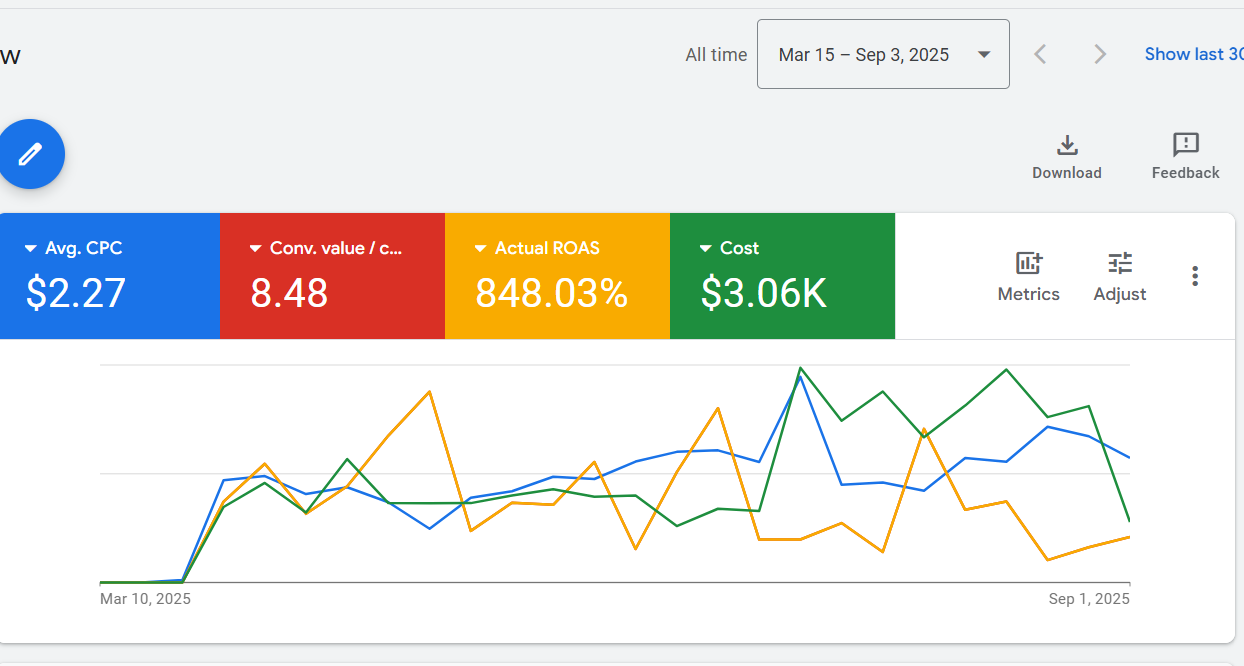
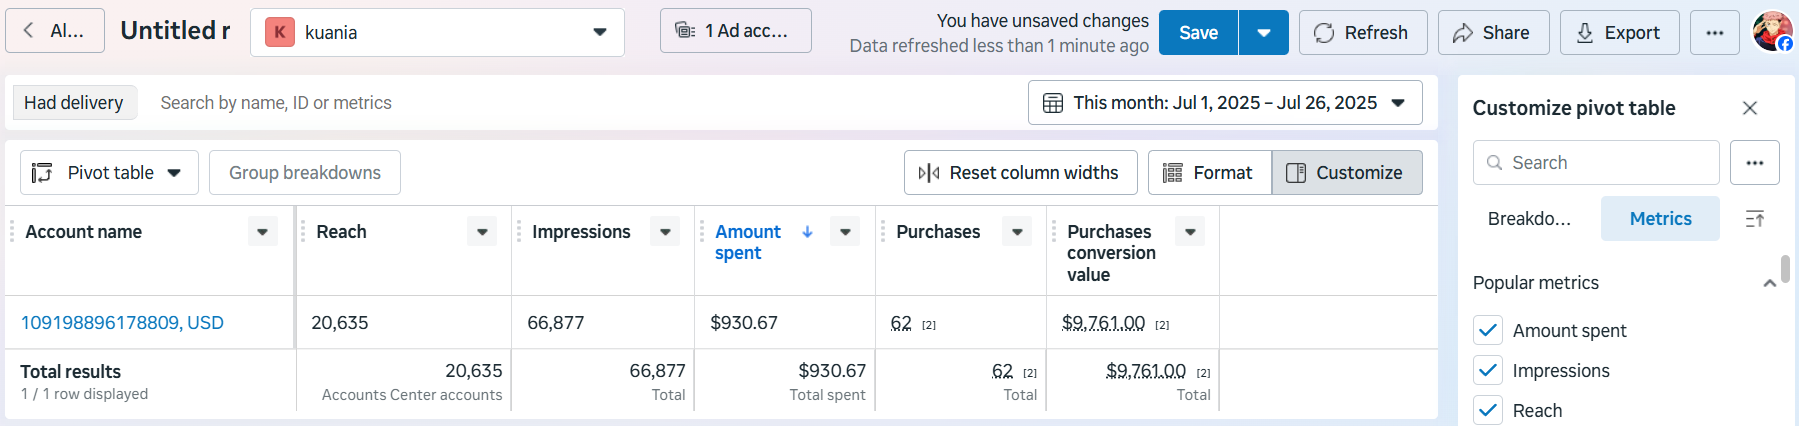
In 3 minutes, see the system we use to scale jewelry brands from $10K → $100K+ with Ads, SEO, and Automations.


Take the quiz — then watch how we scaled one from $18K → $64K/month.
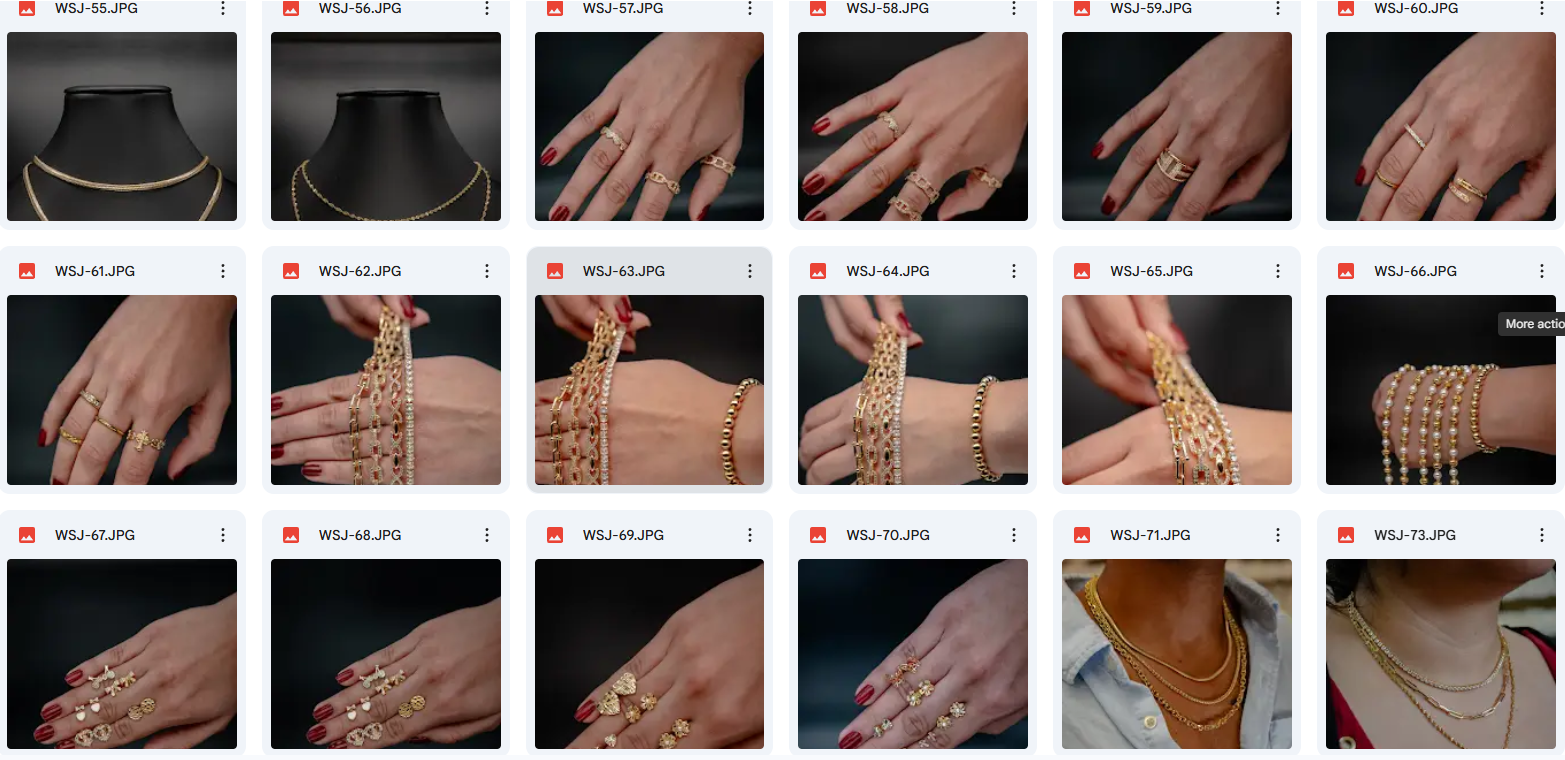
SEE OUR WORK

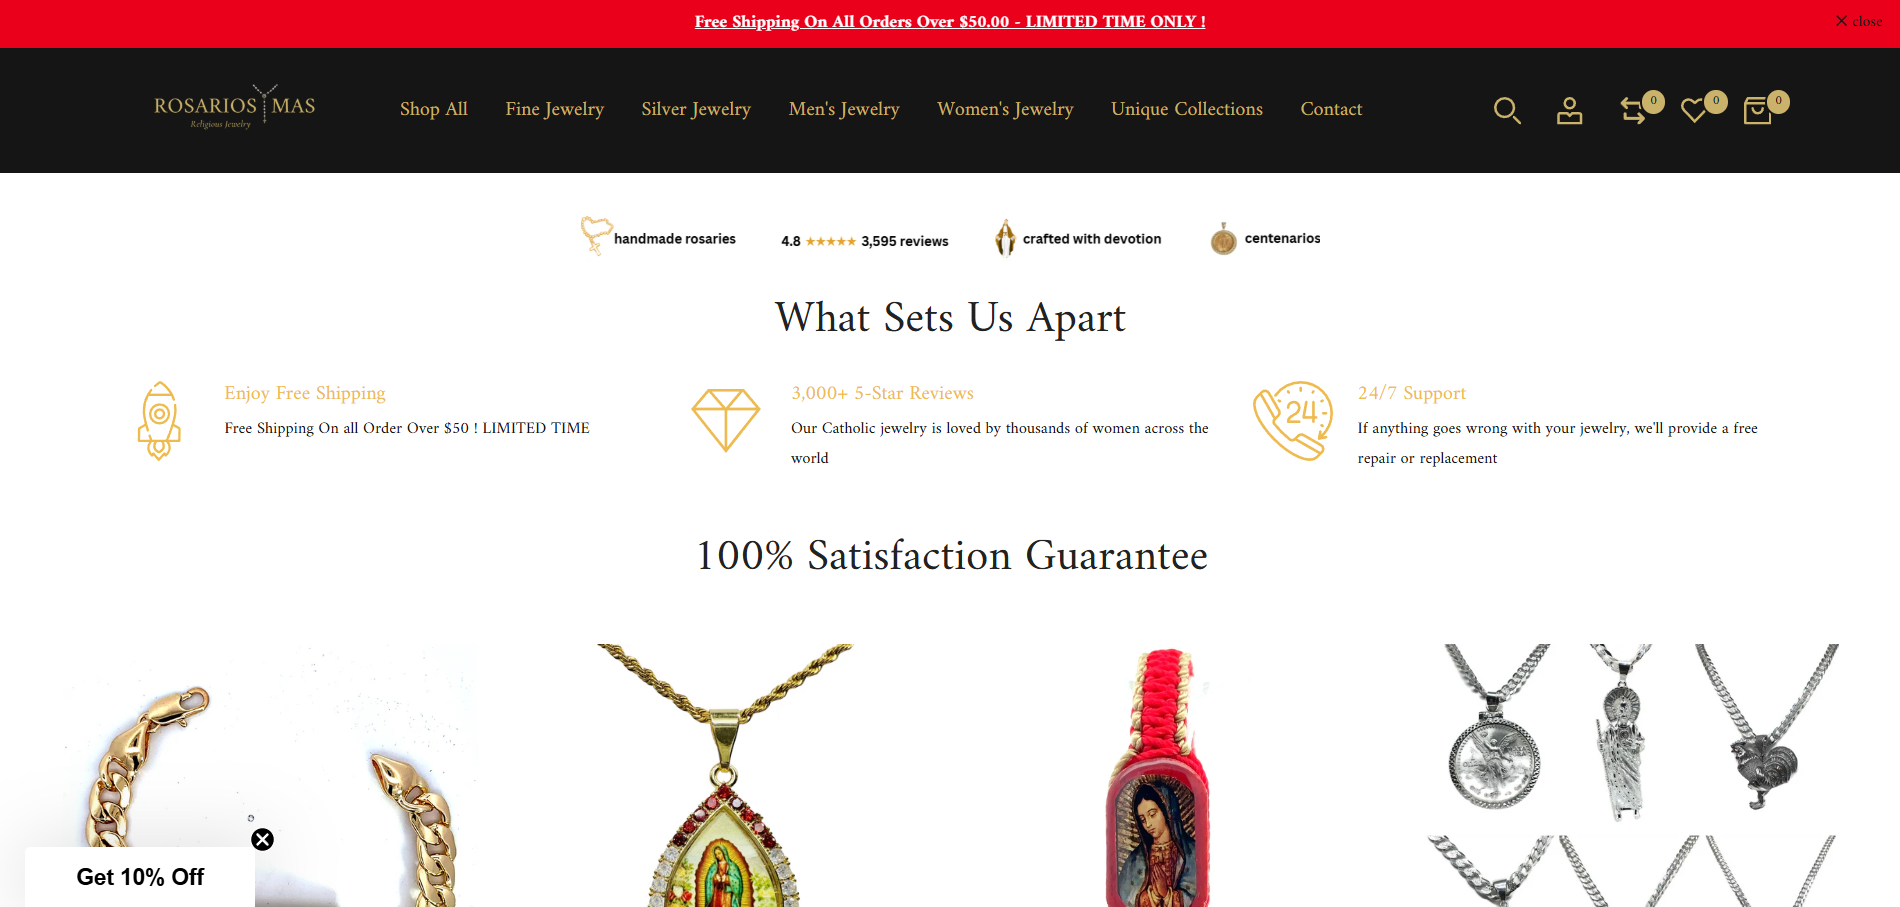
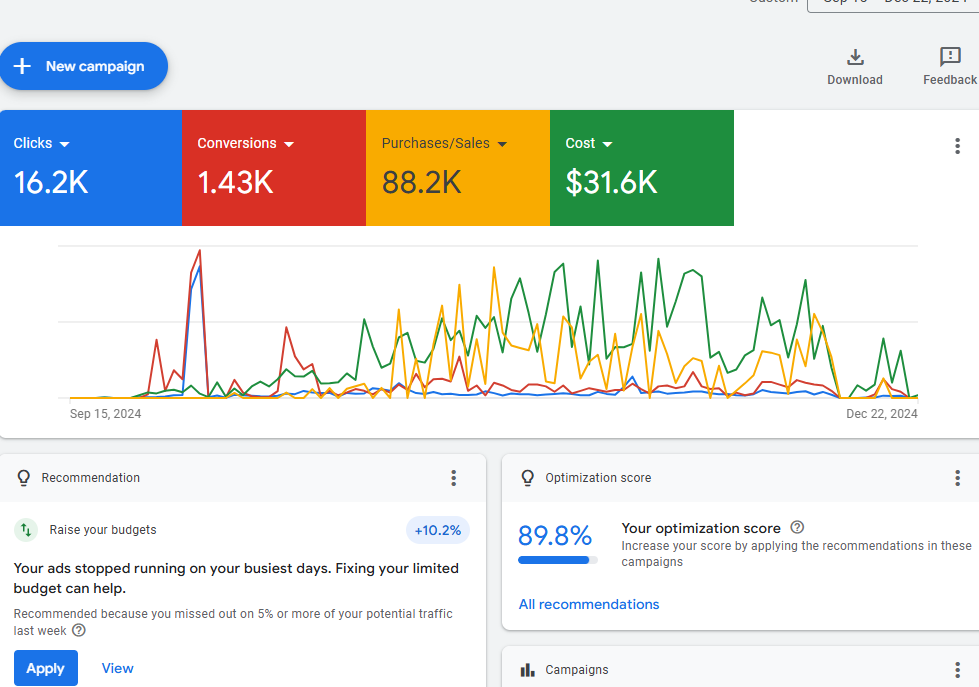
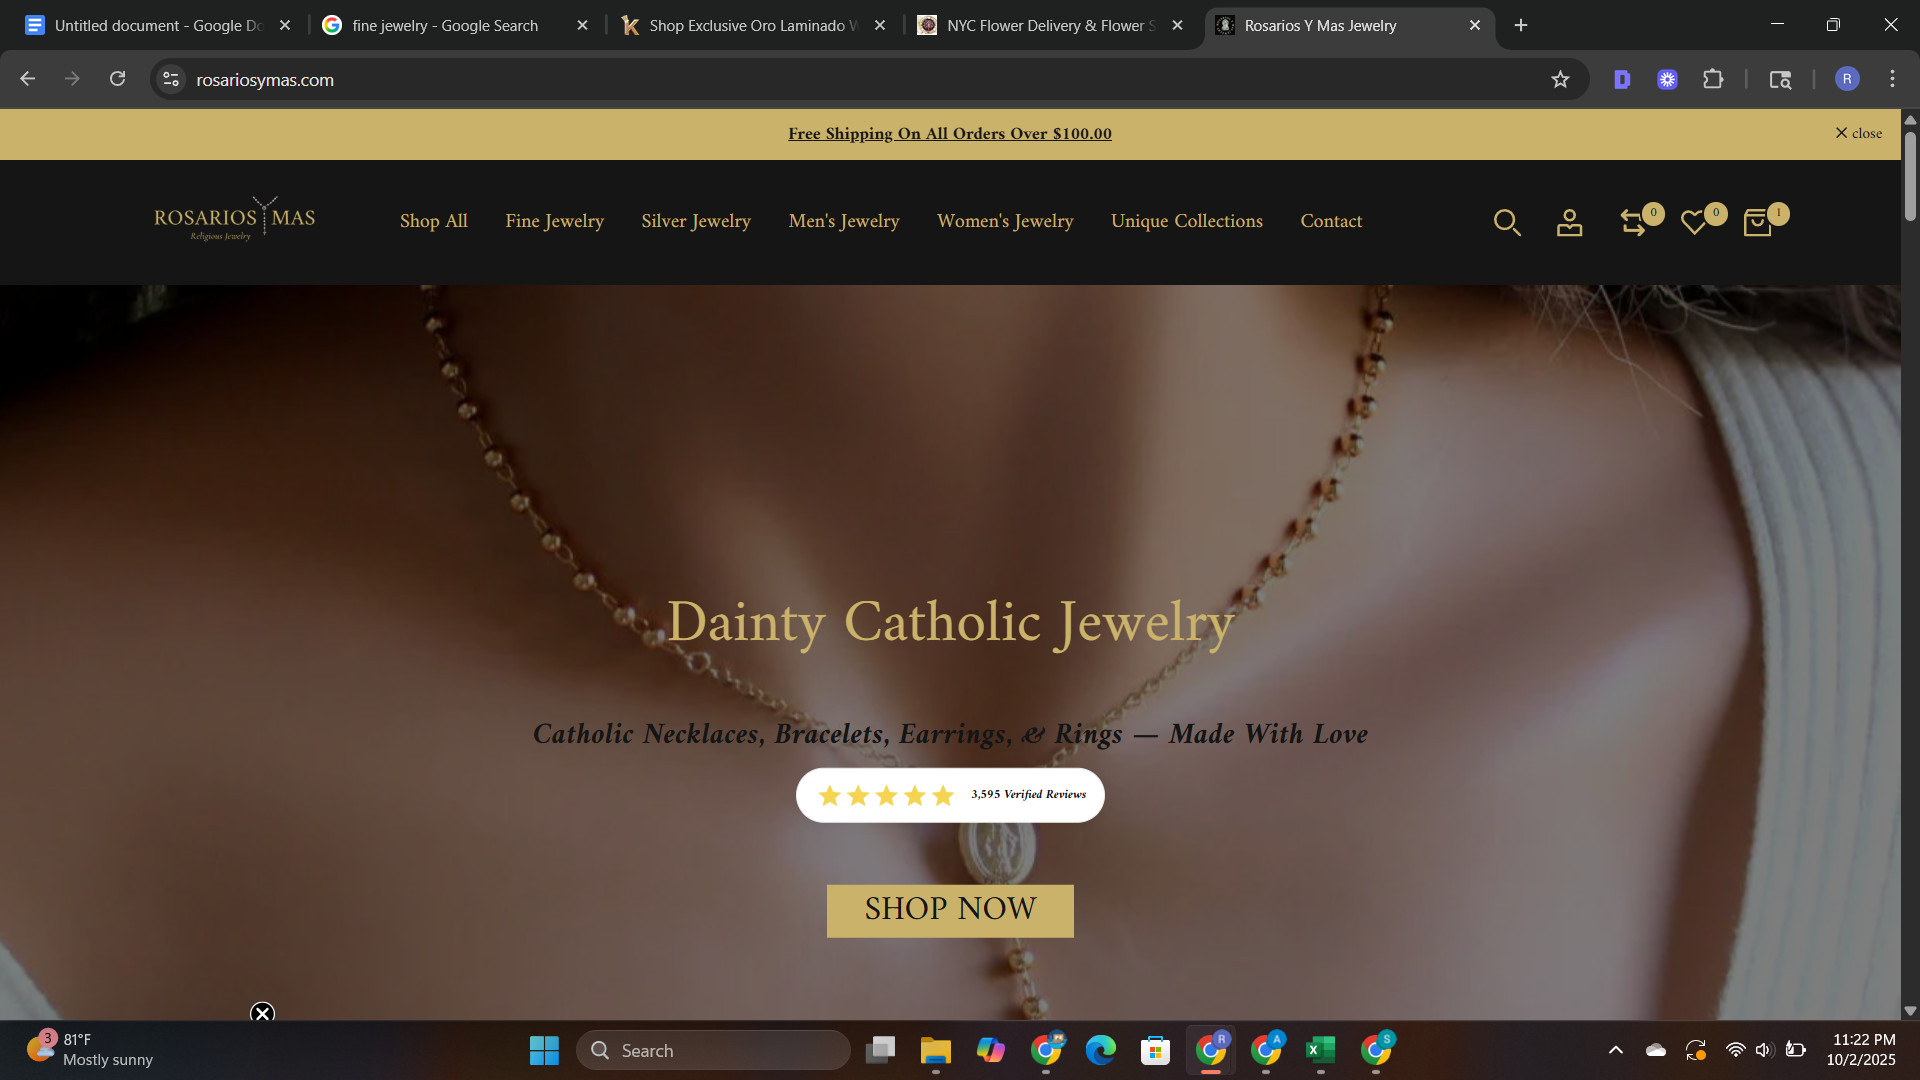
Website Design & Optimization ~ SEO ~ ADS ~ Email Flows ~ Automations
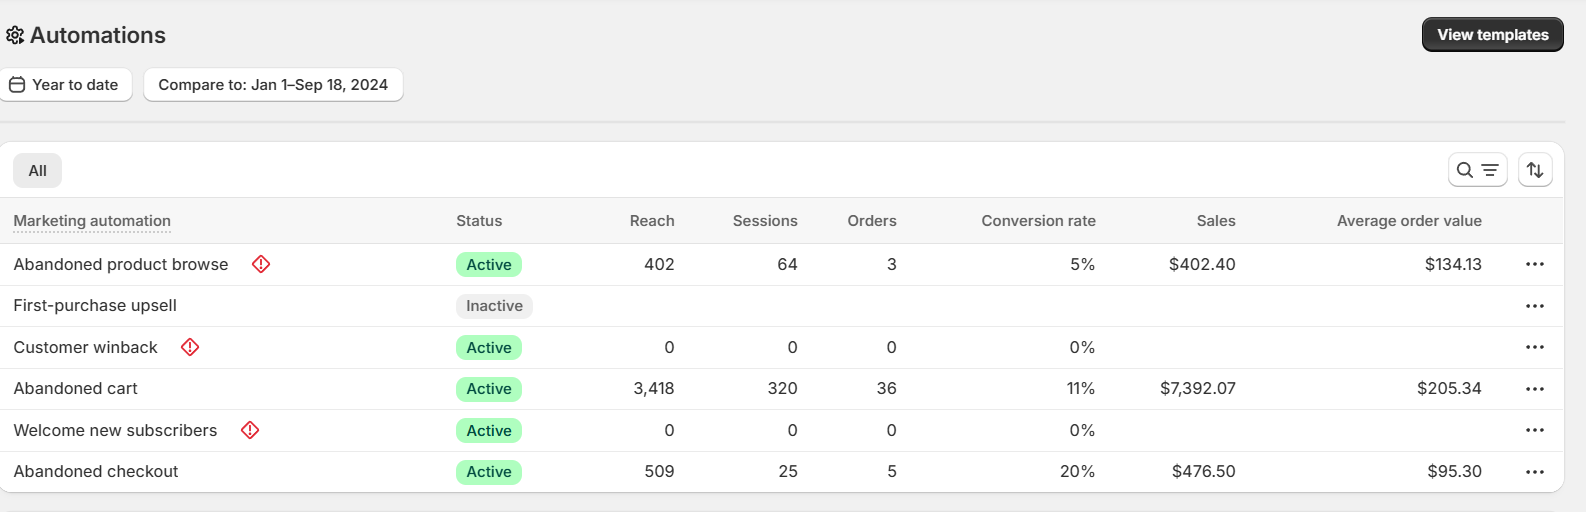
Close-up of a woman's hand with rings, resting on her neck and shoulder, showcasing jewelry at a jewelry website homepage.
A screenshot of marketing automation metrics showing statuses, reach, sessions, orders, conversion rates, sales, and average order values for different automation campaigns, including abandoned product browse, first-purchase upsell, customer winback, abandoned cart, welcome new subscribers, and abandoned checkout.
Screenshot of an online jewelry store webpage featuring various necklaces and jewelry items with headings about free shipping, customer reviews, and satisfaction guarantee.
Shopify analytics report showing total sales over time from October 1, 2023, to September 30, 2024, with a line graph indicating sales growth from approximately $23,000 to over $51,000, highlighting a 38% increase.
Digital marketing analytics dashboard showing campaign performance metrics, including 16.2K clicks, 1.43K conversions, 88.2K purchases/sales, and $31.6K cost with a line graph of data trends from September to December 2024.
Screenshot of a digital marketing dashboard showing campaign data from September to December 2024, including a graph of clicks, conversions, purchases/sales, and costs over time.
A collage of four women wearing gold and silver earrings and jewelry, posing against neutral backgrounds.
A collection of jewelry displayed on black stands, including earrings, necklaces, and bracelets, featuring gold, silver, and diamond designs.
Close-up of a woman’s neck adorned with a silver necklace with white gemstones and a teardrop pendant, advertising a jewelry collection.
Screenshot of a data analytics dashboard showing total sales over time, with a line graph comparing sales from September 27-27, 2025, and August 27-September 26, 2025, and a total sales amount of $63,957.83.
Screenshot of Google PageSpeed Insights results for a website, displaying various performance metrics such as Largest Contentful Paint, Interaction to Next Paint, Cumulative Layout Shift, First Contentful Paint, and Time to First Byte, along with performance scores and device options.
Screenshot of a digital marketing campaign dashboard showing three ad sets named Short Reels 1, Short Reels Comp., and August Ad Set, with metrics such as click-through rate, landing page view percentage, conversions, and ROI, including toggles for ad status and options for reporting and exporting data.
Close-up of a woman's neck and collarbone wearing a gold Catholic necklace with a religious pendant, promoting Catholic jewelry from Rosarios Y Mas Jewelry.
Dashboard showing advertising campaign metrics from February 1 to September 30, 2025, including clicks, purchases, actual ROAS, and cost with a line graph illustrating trends over time.
Close-up images of gold jewelry including necklaces, rings, bracelets, and earrings, worn on woman's hands and neck.
Google Ads performance dashboard showing metrics including average CPC of $2.27, conversion value of 8.48, ROAS of 848.03%, and cost of $3,060 from March 15 to September 3, 2025.
Screenshot of a digital marketing analytics dashboard showing metrics for a specific account, including reach, impressions, amount spent, purchases, and conversion value, with data for July 1 to July 26, 2025.

LEARN HOW TO SCALE