Diagram showing a system for clients with logo icons on the left, arrows pointing to landing pages, ads, email automations, and reporting on the right.

We’ll Build Your Entire Holiday Marketing System for $1,000

⚠️ Limited Spots — We’re a small team taking only a few holiday clients

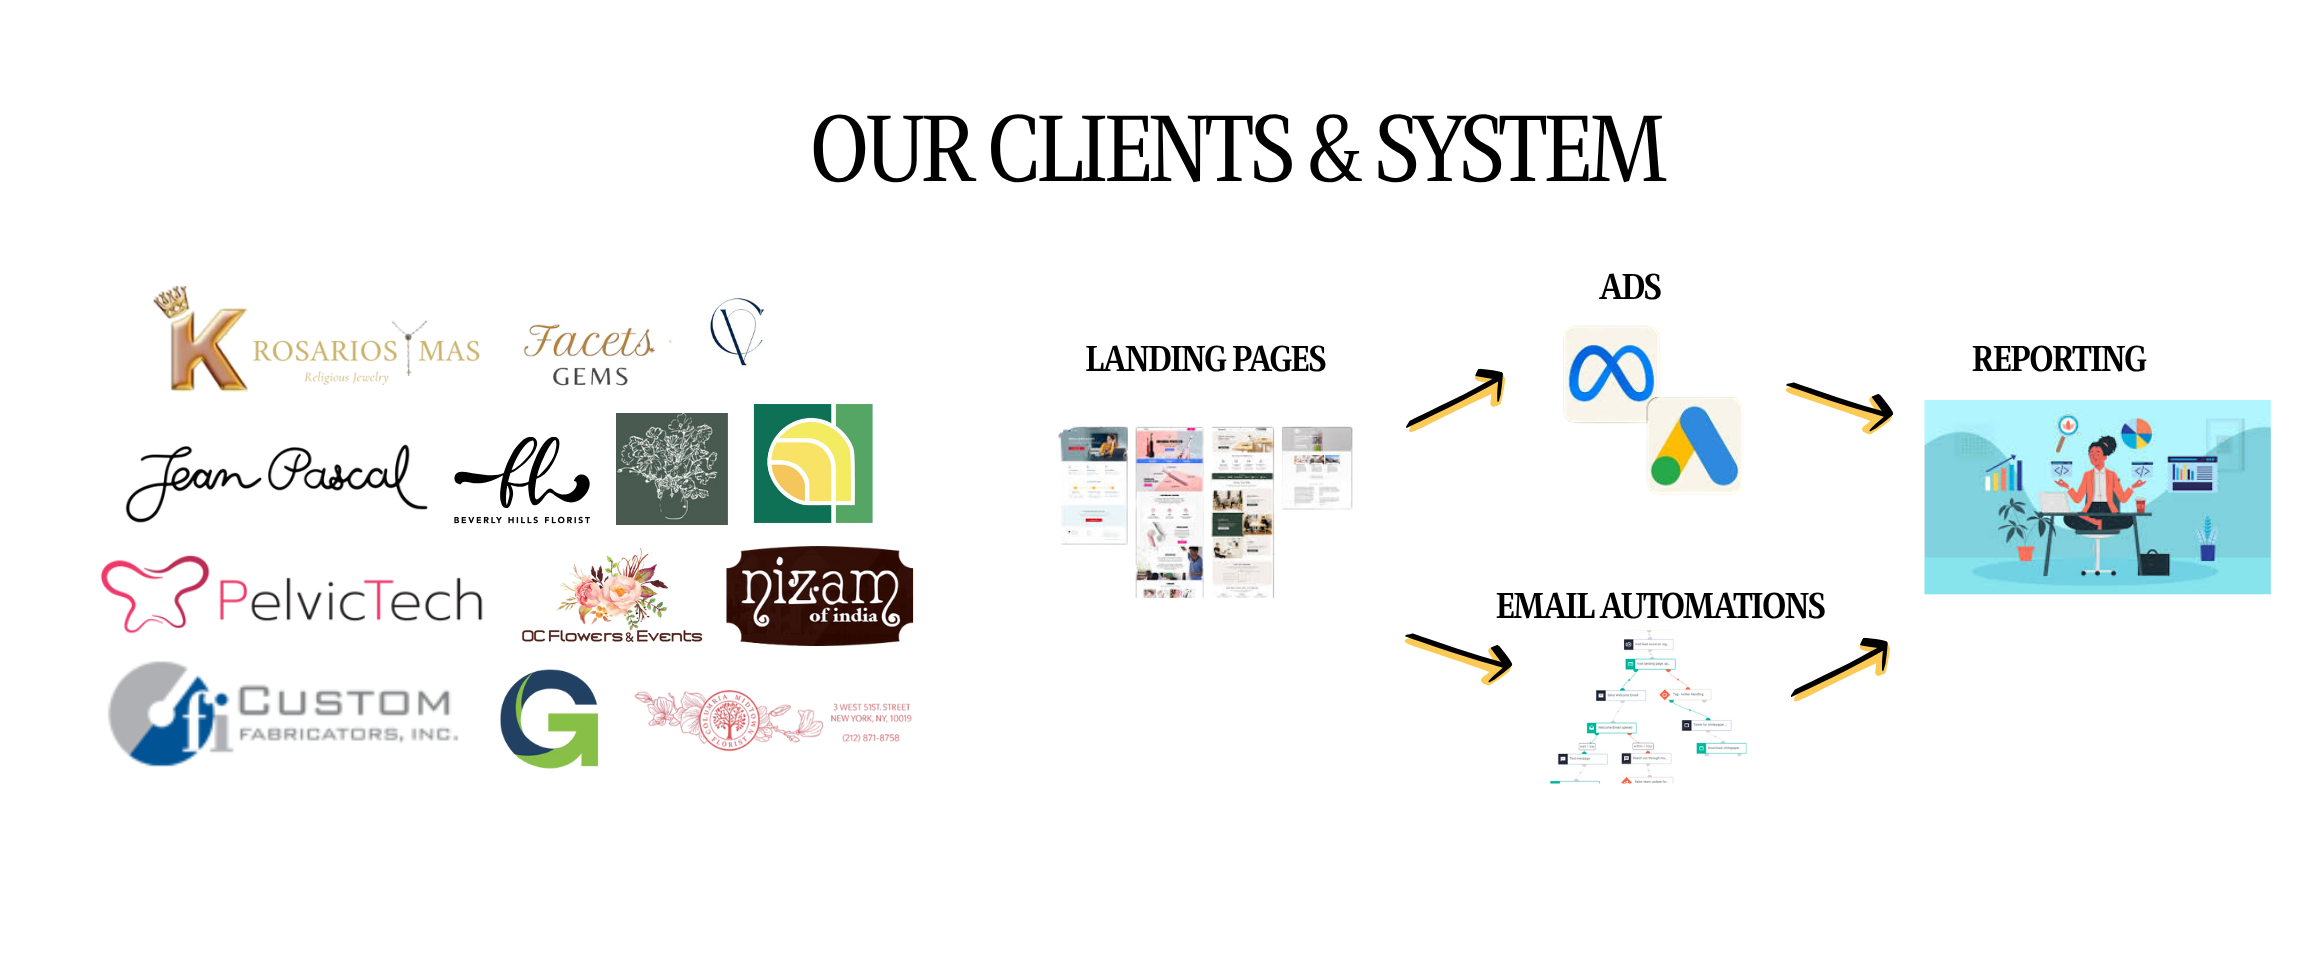
In just 7 days, we’ll set up your ads, email flows, automations, and tracking so you can focus on sales — not guesswork.
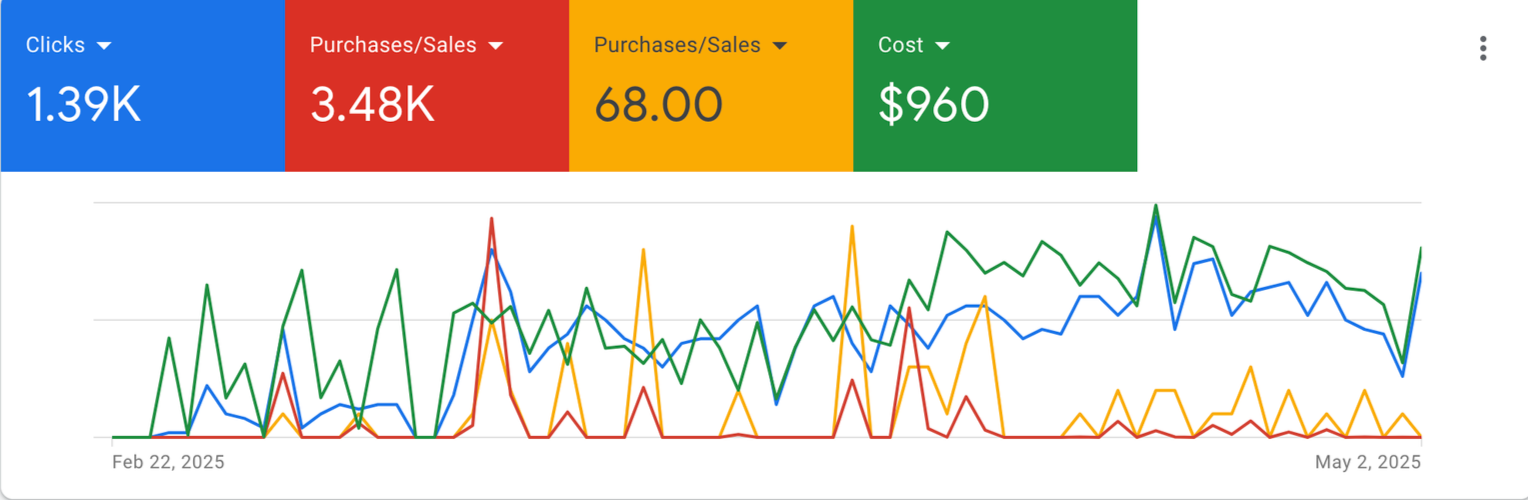
🎯 Ad Campaigns
Meta + Google Ads built and launched for peak holiday buyers.

✉️ Email & SMS Flows
Promo • Abandoned-Cart • Last-Chance sequences that convert automatically.

🛍️ Website Tune-Up
Homepage refresh, pop-ups, and tracking (GA4 + GTM + Pixel) done right.

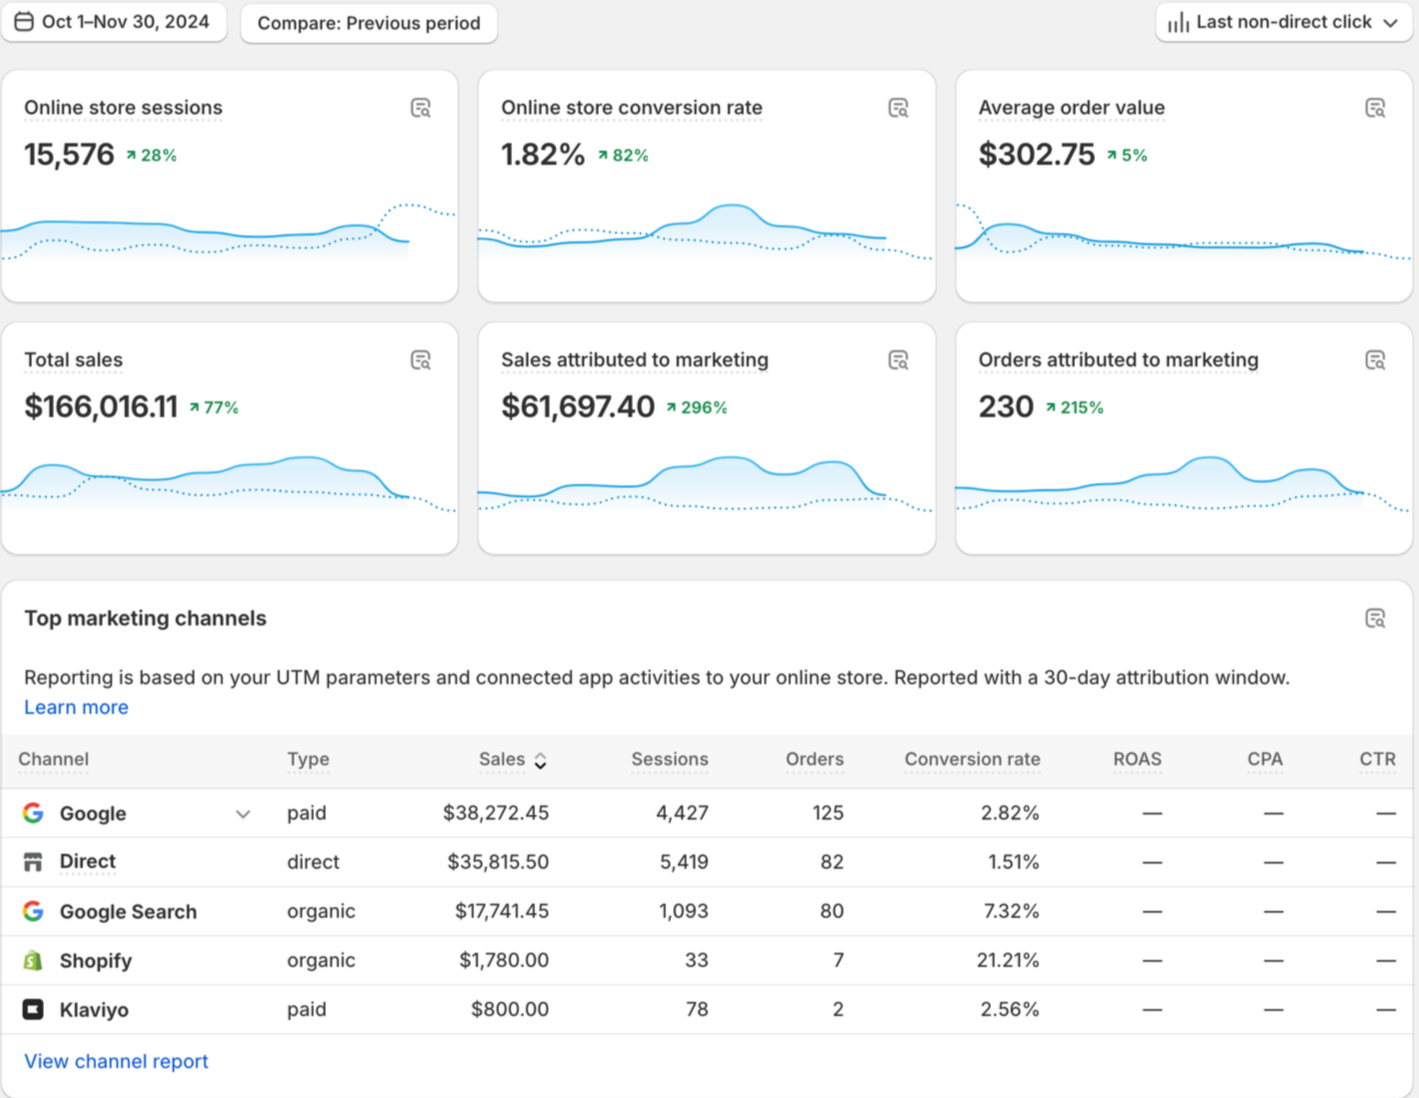
📊 Analytics & Dashboard
Weekly ad-spend, ROAS, and profit tracking in one view.

If you hired separate teams for this…

💰 Ad Setup – ≈ $1,500

✉️ Email + SMS – ≈ $1,000

🛍️ Website + Tracking – ≈ $1,200

📊 Reporting – ≈ $500


Total Value ≈ $4,200+

Yours for $1,000 flat

No contracts • No hidden fees • 7-Day Launch Guarantee

Real Businesses. Real Results.

Jean Pascal Florist

“We went from $0 to $30K/month in online sales.” – Lisa

Kuania Jewelry

“Revenue jumped from $18K → $64K/month after they rebuilt our ads.” – Josh

Rosario y Más

“We saw a 30 % revenue lift in 45 days. Best investment we made.” – Rosario

Little Garden Flower

“From $300 → $4.5K/month in orders. Their system just works.” – Anna

Facets Gems Jewelry

“Helped us attract luxury buyers & boost conversions 40 %.” – Aria

Beverly Hills Florist

“$250K in 90 days. Their ads and creative changed our business.” – David Z.

RESULTS FROM OUR CAMPAIGNS

A digital marketing analytics dashboard displaying key performance metrics from October 1 to November 30, 2024, including online store sessions, conversion rate, average order value, total sales, sales attributed to marketing, orders, and top marketing channels like Google, direct traffic, Google Search, Shopify, and Klaviyo.
A digital marketing dashboard displaying the performance metrics of three ad campaigns for the month of September 2025. The campaigns are titled 'Short Reels 1,' 'Short Reels Comp.,' and 'August Ad Set.' Metrics include click-through rate, landing page view rate, purchase rate, ROAS, and other related data.
Screenshot of a dashboard displaying metrics such as clicks, impressions, conversions, and cost over time, with a line graph showing fluctuations from July to September 2025.
Line graph showing clicks, purchases/sales, and cost from February 22, 2025, to May 2, 2025, with respective values of 1.39K clicks, 3.48K purchases, $68.00 in sales, and $960 in cost.
Screenshot of a digital marketing analytics dashboard showing metrics for clicks, conversions, purchases/sales, and costs over two months, with line graphs and color-coded sections.
Line graph showing website data from September 15, 2024, to December 22, 2024, with metrics for Clicks in blue, Conversions in red, Purchases/Sales in yellow, and Cost in green. Total clicks: 16.2K, conversions: 1.43K, purchases/sales: 88.2K, cost: $31.6K.
Screenshot of a digital marketing dashboard displaying a pivot table with metrics related to account campaigns, including reach, impressions, frequency, amount spent, cost per purchase, purchases, and website purchases conversion value, for the period August 1, 2025 to August 31, 2025.
Line graph showing sales data from October 2023 to October 2024, with total sales amount of $386,615.93 and a 48% increase.
Screenshot of a business analytics dashboard showing revenue, attributed revenue, and the top performing flows for a given week.
Screenshot of online store analytics dashboard showing metrics such as online store sessions, conversion rate, average order value, total sales, sales attributed to marketing, and orders attributed to marketing, with charts and data tables for marketing channels.
Line graph showing website analytics data from July 1, 2025, to September 3, 2025. Metrics include clicks (5.16K), impressions (69K), conversions (189), and cost ($5.84K). Different colored lines represent each metric.